Blog
Product Updates
The latest updates and improvements to the Visible application.
All
Fundraising Metrics and data Product Updates Operations Hiring & Talent Reporting Customer Stories

investors
Product Updates
Improve Workflows With the Visible + Airtable Integration
"This just made my reporting life 100x easier" — Olivia O'Sullivan, Forum Ventures
Jay Baer said, “We are surrounded by data but starved for insights.” Having a system to leverage your data to uncover insights takes a venture capital firm’s operations from good to best-in-class.
With the Visible + Airtable integration, you can automatically send reports from Visible to an Airtable database. Check out the portfolio information that can be exported from Visible Reports below:
Company Properties (Ex: Sector, HQ location, Recent Updates)
Investment Properties (Ex: Latest Price Per Share, Ownership %)
Metrics/KPIs with custom insights (Ex: Revenue, Revenue QoQ)
Learn more about how you can leverage Visible + Airtable for your firm by booking a call with our team below:
How it Works
Export your Visible Reports to an Airtable database with two clicks. Simply navigate to the report you’d like to export, connect your Airtable account, and sit back while your Visible Report is automatically sent to Airtable.
From here, combine data with existing data in Airtable to streamline reporting and uncover new insights across your fund.
Put Visible + Airtable to Work for Your Firm
Ready to level up your portfolio management and reporting at your firm? Schedule a call with our team to learn more about how you can leverage Visible to centralize portfolio company data, uncover insights, and power your LP reporting and team meetings.

investors
Product Updates
Product Update: Seamless Dashboard Management
Visualizing and analyzing portfolio data is an important part of taking portfolio monitoring seriously at any venture firm.
Visible makes this easy with four different dashboard types:
Flexible dashboards
Portfolio metric dashboards
Fund performance dashboards
Tear sheets (which have the same functionality as flexible dashboards but are restricted to a one-page format)
Related resource: Unlocking Venture Capital Portfolio Insights with Dashboards
In these latest product updates, Visible makes it easier for VCs to maintain data visualization accuracy and ensure that the qualitative information about portfolio companies is as up-to-date as possible on flexible dashboards.
The main reason VCs create flexible dashboards on Visible is to support their internal portfolio review meetings. These meetings help VC firms align on the progress updates across the portfolio and make strategic decisions related to portfolio support and follow-on investments.
Keep reading to understand how recent product updates make it even easier to manage and update data visualizations on Visible's flexible dashboards.
Recent Dashboard Management Product Updates
Setting date ranges at the dashboard level
With this product update, investors can filter entire dashboards by a custom date range in addition to setting specific date ranges at the widget level. This streamlines the dashboard creation and maintenance process.
Automatically updated company highlights and lowlights
Investors can now request properties in Visible Requests and when companies submit their responses to qualitative questions, the property widgets are automatically updated on dashboards. This saves investors several steps in the process of making qualitative updates from their companies accessible to their wider team.
Editing properties inline on dashboards
This update lets investors quickly edit the property values displayed on portfolio company dashboards. Examples of properties commonly updated include:
"Recent updates"
"Company description"
"Notes"
"Last discussed"
Giving users the ability to edit properties directly on a dashboard means investors don't have to navigate back and forth between the dashboards and properties section to make changes to their dashboards.
investors
Product Updates
Reporting
Metrics and data
Product Update: Turn Emails Into Insights With Visible AI Inbox
Structured data. The holy grail of business intelligence.
Structured data unlocks a realm of possibilities, from setting benchmarks to enhancing decision-making processes. Yet, in the venture capital landscape, accessing reliable, structured data remains a formidable challenge. This is precisely why we created the Visible AI Inbox.
With unique features like automated metric detection and file parsing, the Visible AI Inbox stands out as a pioneering solution for portfolio monitoring. Discover how it can transform your data strategy by meeting with our team.
Turning email into insights
We believe that investors should spend time sourcing new deals and helping founders, not manually copying and pasting data from email 🙂.
The AI Inbox helps aggregate insights that exist siloed in data, files, and updates across a venture firm. Updates from founders often stay stuck in one team member's inbox because it's too time-consuming to extract and enter the data and files into a more centralized repository. Visible AI Inbox makes this possible within seconds.
Requests + AI Inbox = A Complete Picture
The addition of the AI Inbox continues to advance our market-leading portfolio monitoring solution. The pairing of Requests + the AI Inbox will give investors a holistic view of portfolio company performance across a fund.
Visible continues to be the most founder-friendly tool on the market. We’ll continue to build tools in existing workflows where both founders and investors live every day.
How Does it Work?
Visible AI Inbox works in three simple steps.
Forward emails to a custom AI inbox email address
Visible AI automatically maps data and files to portfolio companies
Investors can review and approve content before it is saved
From there, dashboards, tear sheets, and reports are all automatically updated on Visible.
Learn more about how Visible AI Inbox can streamline workflows at your firm by meeting with our team.
FAQ
Will this be available on all plans?
Visible AI Inbox is only available on certain plans. Get in touch with your dedicated Investor Success Manager if you want to explore adding this to your account.
How is Visible addressing privacy and security with Visible AI Inbox?
No data submitted through the OpenAI API is used to train OpenAI models or improve OpenAI’s service offering.
Visible AI Inbox leverages OpenAI GPT 4 and proprietary prompts to extract data in a structured way and import it into Visible.
If you’re uncomfortable with utilizing OpenAI to optimize your account, you can choose not to utilize this feature. Please feel free to reach out to our team with any further questions.
These processes adhere to the guidelines outlined in Visible’s privacy policy and SOC 2 certification.

investors
Product Updates
Metrics and data
Product Update: Fund performance dashboard templates for VCs
Fund performance dashboard templates are here
Fund performance dashboard templates empower investors to build a best practice investment overview dashboard in 2-clicks and easily share it with stakeholders or team members.
How it works
Ensure your investment data is up to date in Visible and then select which fund data you want to visualize. Visible automatically creates a dashboard based on best practices. The dashboard includes key fund data and insights that help investors understand and communicate how their fund is performing. From there, the user can customize the dashboard by adding or removing widgets, changing the layout, changing colors, adding commentary and more.
The dashboard can then be duplicated and applied to different funds.
Fund metrics supported in Visible
Visible supports over 25 fund metrics and calculated insights including:
Total invested
Average investment amount
Total number of investments
Number of exits
Capital remaining
Follow on capital deployed
Gross IRR
Net IRR
Multiple
Total capital called
New capital deployed
% of fund called
Realized FMV
RVPI
TVPI
DPI
Management fees
Capital called
Escrow
Expenses
Carried interest
Distributions
and more
Learn more about the key fund metrics and calculated insights supported in Visible here.

investors
Product Updates
Product Update: Conditional blocks supported in Visible Requests
Visible now lets investors add conditional blocks to a Request. This equips investors to build even more founder-friendly data Requests by only asking for relevant details from companies that meet certain conditions.
What are conditional blocks?
Conditional blocks are displayed only in a Request when a company meets predefined criteria (or condition) set by an investor. This way investors can keep Requests sent to portfolio companies as concise as possible.
Related resource: What metrics should I be collecting from my portfolio companies?
Examples of using conditional blocks in a Request
An example of when an investor might add a conditional block to a Request is when an investor is collecting information related to companies' recent fundraising. In the example below an investor is asking for additional fundraising details based on the condition that the company is actively fundraising.
By using a conditional block, companies who are not fundraising will not be asked questions that are not relevant to them.
Over 350+ VCs use Visible to streamline their portfolio monitoring and reporting.

investors
Product Updates
Product Update: Investment overview table
What's new
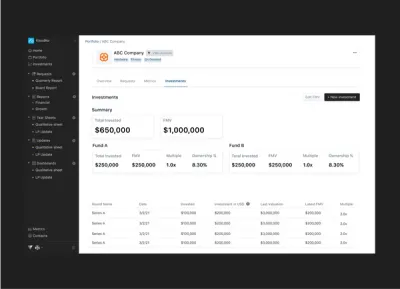
The investment overview table on portfolio company profiles is now more comprehensive.
In addition to portfolio data collection tools, Visible also empowers VC firms with a source of truth for their portfolio investment records. Visible's investment data solution is more accessible and easy to digest than the status quo Excel file master sheet that many firms rely on... but don't really trust.
With this recent update to our investment data tracking solution, we've made the overview table on companies' profiles more comprehensive so you can see the history of changes to fair market values and exits all in one view. Previously changes to fair market value were handled in a separate window which required users to take additional steps to make edits.
What's included in a portfolio companies investment table overview
The following details are included in a companies investment table overview:
Direct investment details
Visible supports the following investment types Equity, SAFE, Convertible Note, Debt, Token, and other
Follow on investment details
Visible lets investors track rounds even if they do not participate
Changes to fair market value
Visible lets users document the FMV justification, notes, and who it was approved by
Exits
Visible empowers investors to keep track of exit details which keeps their fund metrics up-to-date and accurate
Related resource: VC Fund Performance Metrics 101 (and why they matter to LPs)
Learn more about Visible's investment data tracking capabilities by meeting with our team.

investors
Product Updates
2023 Product Highlights | Visible's portfolio monitoring and reporting solution for investors
This year Visible made it even easier for investors to collect important information from their portfolio companies, transform it into meaningful insights, and share engaging updates with their teams and stakeholders.
2023 by the numbers
8k+ - The number of portfolio companies actively monitored on Visible
92k+ - The number of reminder emails investors didn't have to send
12k+ - The number of LP Updates sent to investors
Check out Visible's highlighted 2023 product updates below.
Updates to getting data into Visible
Over 350+ VC funds are using Visible to streamline the way they collect and centralize data from their portfolio companies. Here's how the recent product updates make this process even easier.
Automatically import KPI data with Visible’s Portfolio metric import tool. (Learn more)
Request information from portfolio companies based on conditional logic. (Learn more)
Easily collect 6 periods of historical and forecast data from your companies. (Learn more)
Schedule a One-time Request to collect any data on a one-off basis. (Learn more)
Ask for property information in Requests to keep company profiles up to date. (Learn more)
Updates to transforming data into meaningful insights
To get the most value out of portfolio data, investors need tools that make it easy to transform the data into portfolio intelligence. Visible's data analysis tools help investors unlock insights to improve the way they provide support and inform investment decisions.
Compare performance across your portfolio with Portfolio metric dashboards. (Learn more)
Customize and scale your LP reporting with Tear sheets. (Learn more)
Slice and dice portfolio data with Segment metrics. (Learn more)
Save time by applying a Dashboard template to all your companies. (Learn more)
Updates to communicating portfolio information with stakeholders
The most valuable types of insights are the ones that are easiest to communicate and share with others. Keep reading to learn how Visible made it even easier for investors to keep key stakeholders up to date.
Integrate qualitative responses from companies directly into your Tear Sheets and Dashboards. Learn more.
Track, visualize, and share 25+ fund metrics including IRR, MOIC, TVPI, DPI and more. Learn more.
Portfolio companies can turn responses to Requests into narrative updates using Visible AI. Learn more.
Join a community of over 350+ VCs streamlining their portfolio monitoring and reporting with Visible.

investors
Reporting
Product Updates
Product Update: Analyze Your Portfolio Data with Segment Metrics
Visible recently released Segment Metrics, a premium portfolio insights tool for VCs. The solution empowers investors to answer key questions about their portfolio performance in seconds instead of hours.
How investors can unlock portfolio insights faster with Segment Metrics
With Segment Metrics investors can find insights related to the sum, average, minimum, and maximum for any custom segment of their portfolio metric data and investment values.
Example Segment Insights
Examples of insights that can be uncovered with Segment Metrics include:
The amount invested in female founders vs non-female founders
The breakdown of investments based on sector, geography, and stage
A comparison of revenue across seed-stage investments
Investors can keep track of these insights by embedding the data visualizations on flexible, shareable dashboards in Visible as shown in the example below.
Learn more about setting up Segment metrics in our Knowledge Base.
Learn More About Visible
Visible has a suite of tools to help with portfolio data analysis including
Robust, flexible dashboards that can be used for Internal Portfolio Review meetings
Portfolio metric dashboards to help with cross-portfolio insights
Learn more about how 400+ Venture Capital investors use Visible to streamline their portfolio monitoring and reporting.

investors
Product Updates
Reporting
Product Update: Visible AI Updates
Did you know that 60% of investors don't hear from their portfolio companies on a regular basis? This means that the startups sending regular communications to their investors stand out the most. In fact, startups that provide regular investor updates are 3x more likely to receive follow-on funding.
Making the time to write a compelling investor update regularly can be challenging for startup founders. This is where Visible AI Updates comes in.
What is Visible AI Updates
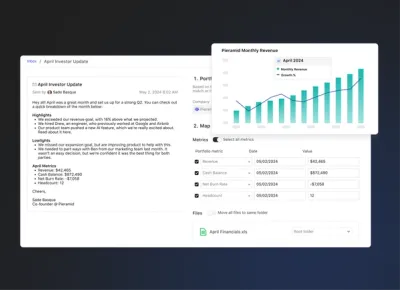
Visible AI Updates automatically turns Visible Request responses that portfolio companies submit to Visible into a narrative Update that startups can use to share with other investors and stakeholders. This equips founders to send regular, professional communications to all their greatest supporters (and sources of follow-on capital), with ease.
Learn more about Visible AI updates and how you can leverage it with your Visible account below.
How it Works
Visible AI Updates is available to founders who are completing Visible data Requests from their investors.
Using the metrics and qualitative answers from a data Request, Visible AI Updates adds context and builds charts to turn the information into a Visible Update that can be shared with other investors and stakeholders.
Visible AI Update Example
Using the qualitative answers and data included in your Request, we’ll help you turn the response into an Update using the following logic:
“{Company Name} Investor Update” — For example, “Acme Co Investor Update”
In order to create the content of the update we built a prompt for OpenAI that contains questions and answers from the request. We will create charts and tables for any metrics using the following logic:
If a metrics question contains >3 metrics we will create a single table with all these metrics within the update
Otherwise, we create bar charts for each metric in the question.
Note: if a metric only has a single data point we will create a number chart instead.
As always, we recommend reviewing your Update and making sure all of the content is correct and fits your voice. You can check out the full example of the Update here.
Visible AI Updates Takeaways
Providing investor updates regularly increases your likelihood of success and your ability to fundraise
Visible AI transforms your Requests responses into a professional narrative update that you can share with all your stakeholders
The Future of Visible AI
This is our first introduction of AI into the Visible platform. In the months ahead we plan on exploring AI models to help with fundraising email copy, identifying potential investors for your business, and more. We are always looking for feedback. Feel free to share your AI-related ideas to support at visible dot vc.

investors
Reporting
Product Updates
Q3 Product Webinar – Streamlining end of year reporting with Visible
Check out Visible’s recorded product webinar to learn about the most recent updates to Visible’s portfolio monitoring and reporting platform. The Visible team demonstrates how to leverage recent product changes to improve your portfolio reporting in Q4 and beyond.
Product webinar topics:
Common use cases for one-time Requests and how to set them up
Saving time by syncing company qualitative responses to Dashboards and One-Pagers
Exporting data to Google Sheets for external analysis and reporting
Embedding a dashboard in Notion to share with your team
Q&A

investors
Product Updates
What’s New in Visible for Investors — H1’ 2023
In the first half of 2023, Visible remained dedicated to helping our community of 350+ investors streamline the way they collect, analyze, and report on their portfolio data. We saw the slowdown in Venture Capital activity during the first part of the year translate into an increased need for accurate and up-to-date portfolio insights that can easily be shared internally and with stakeholders. Both Venture Capital investors and their Limited Partners are relying on data-informed insights more than ever before to guide their next steps.
To best support our investors, we focused on making updates to three core functions of our portfolio monitoring and reporting platform during the first half of 2023:
Keep reading to learn about some of the specific updates made to our platform during the last six months.
Changes to Getting Data into Visible
These product updates allow investors to more easily collect budget vs actuals KPI’s and send reminder emails to all their companies at once.
Send bulk one-off reminders to all companies (learn more)
Ask for up to six future and historical custom KPI’s (learn more)
View and edit company metrics in dynamic time periods
Changes to Visualizing, Analyzing, and Sharing Portfolio Insights
With these changes, users can more easily identify quick insights about their portfolio performance and share it with their team and LPs.
Extract quick insights about your portfolio with Portfolio Metric Dashboards (learn more)
Applying a custom dashboard template to all companies (learn more)
Build a flexible One Pager template for LP reporting (learn more)
Uplevel your data visualizations by adding color gradients to your charts (learn more)
Share your portfolio company dashboards via a link and choose to password-protect them (learn more)
Learn more about analyzing portfolio data with custom dashboards in Visible.
Changes to Investment Data Tracking
The following updates allow investors to track all their key investment data and fund metrics within Visible. This gives investors real-time control over updating, visualizing, and sharing their fund performance.
Convert Convertible Notes to equity with ease (learn more)
Track follow-on rounds you don’t participate in (learn more)
Choose a custom exchange rate for investment round details (learn more)
Capture all your core fund metrics in Visible (learn more)
Track and visualize IRR at the fund and company level (learn more)
Visualize auto-calculating fund metrics (learn more)
Ready to improve your firm’s portfolio monitoring and reporting processes?
investors
Product Updates
Reporting
Unlocking Venture Capital Portfolio Insights with Dashboards
If your portfolio data is patched together in an excel file with questionable version control or is buried in a slide deck prepared six months ago, your team is likely missing the opportunity to take action on important portfolio insights.
Up-to-date, accurate portfolio insights help venture capital investors:
Provide better portfolio support
Make data-driven investment decisions
Validate markups and markdowns during evaluation exercises or an audit
Demonstrate traction to LPs while fundraising for future funds
…but only if the insights are accessible.
Visible’s dashboards help venture capital investors visualize and explain the journey companies are on in a way that actually resonates.
Learn more about leveraging dashboards in Visible.
About the Guide
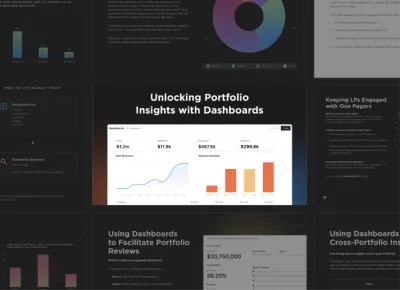
This guide demonstrates how venture capital investors can turn their portfolio data into actionable, accessible insights. The guide also includes examples of three different flexible dashboard types in Visible.
Topics covered include:
Portfolio data collection best practices
Creating dashboards for internal portfolio reviews (Flexible dashboards)
Identifying cross-portfolio insights (Portfolio metric dashboards)
Sharing portfolio insights with Limited Partners (One pagers)
Visible has helped over 350+ venture capital funds streamline the way they collect, analyze, and report on core metrics from their portfolio companies on a regular basis.
investors
Product Updates
Visible’s 2022 Year in Review
Visible is a founder-friendly portfolio monitoring and reporting solution used by VC’s around the world.
Thanks to the continued engagement from our investor community, the last twelve months at Visible have been full of growth. As a Visible user, you’ve helped bring more transparency to the Venture Capital industry through improved KPI tracking, accessing deeper portfolio insights, and by more regularly communicating with your companies, teammates, and LP’s.
Here are some 2022 highlights:
7k+ Requests completed by portfolio companies around the world
550+ LP Updates were sent to investors
800+ Investors deepened their VC expertise by engaging with our educational webinars
300+ VC firms verified their profiles in our Connect database
Biggest Product Updates of 2022
More Flexible & Scalable Dashboards
Portfolio Dashboard Templates – A more scalable way to visualize and extract insights from portfolio company data.
Flexible Dashboard Grids – Flexible widget sizing means you have more control over how you can display data visualizations for you and your team.
Intraportfolio Benchmarking and Insights – Compare individual company performance against portfolio quartiles using custom segments.
Improved Portfolio Request Experience
Request UI Overhaul – It’s now much easier to understand when your Request has been sent, % completion, and when the next scheduled reminder email will be sent.
Multiple File Uploads in Requests – Companies can upload multiple files into the same file block in a Request, saving them time each reporting cycle.
Export Request Summaries – Easily export and analyze Request responses in just a few clicks.
Re-open a Request – Mistakes happen. Re-opening a Request lets companies re-submit their data.
Advanced Investment Insights
Chart Investment and Fund Metrics – Chart and visualize key fund metrics such as TVPI, RVPI, DPI, and more.
Automatic SAFE Conversion & Token Support – Visible supports 6+ investment types.
Multiple Funds – Segment your investment data by fund in custom-built reports.
Interested in learning more about Visible’s portfolio monitoring solution for investors? Book a demo below.
Interested in learning more about Visible?
Meet with Our Team
Webinar Recap from 2022
More than seven thought leaders from around the world joined us to share their expertise in different topics related to improving the venture capital ecosystem. Check out the recordings and resources below.
ESG Best Practices with Tracy Barba ESG for VC –> Watch Here
Building Scalable Support with Jessica Lowenstein of K50 Ventures and Erica Amatori of Left Lane Capital – Watch Here
Benefits of a Hybrid SPV + Fund Strategy with Kingsley Advani of Allocations — Watch Here
LP Reporting Best Practices with Aduro Advisors — View the Report
SaaS Company Benchmarking with Christoph Janz of Point Nine Capital — Watch Here
Best practices for portfolio monitoring & reporting with Gale Wilkinson of VITALIZE Venture Capital — Watch Here
Interested in learning more about Visible?
Meet with Our Team
How to Partner with Visible in 2023
Increase your VC firm’s brand awareness by hosting your Update template in our public Update Library for investors.
Refer your investor friends to Visible and receive a $500 Amazon gift card.
Invite us to host a webinar for your portfolio companies on ‘Investing in Investor Updates’.
Verify your firm’s profile in our investor Connect Database.
To get started with any of the partnership opportunities above, send an email to belle@visible.vc.
Interested in learning more about Visible?
Meet with Our Team

investors
Product Updates
Product update: Introducing Visible Metric Benchmarks
Understanding the performance and impact of your portfolio is critical for decision making, follow-on investments, and raising future funds.
Available today, metric benchmarks will give investors instant insights into portfolio company operational performance.
Visible will automatically provide investors the following:
Total – The total sum for a given metric included a time series trend chart
Minimum – The minimum value and respective company
Maximum – The maximum value and respective company
First Quartile 25%
Median Quartile 50%
Third Quartile 75%
Investors will also be able to view benchmark data for any current segments or for a particular period.
Quartiles
Investors can also select any portfolio company to quickly view their performance relative to the respective portfolios.
As always let us know if you have any questions or feedback!
Up & to the right,
Mike
investors
Product Updates
Product Update — Improve Your Fund Analytics with Multiple Funds
We’re excited to share that our Multiple Funds feature is now live. This means you can now drill into your investment data and fund analytics with even more precision than before.
Assign investments to different funds to view and compare individual fund analytics. Slice your data even further with custom segments. Answer questions like “How does the multiple for our SaaS companies from Fund I compare to the multiple for our SaaS companies in Fund II” in seconds.
Get started with Multiple Funds within your Visible account or schedule a call here to learn more.
Unlock Your Investor Relationships. Try Visible for Free for 14 Days.
Start your free trial